The Clutchers

Meta advertising agency

Meta Advertising Agency That Scales Profitably

Creative, media buying and tracking handled by one team across Facebook and Instagram. We build accounts that hold their return as spend goes up, not just on the first good week.

  • Facebook ad management services built around tested creative volume
  • Instagram ads management services covering Reels, Stories and feed
  • Clean tracking with server side events, so the numbers you report are real
$8.4MAd spend managed
4.1xAverage blended ROAS
2.6KCreatives tested
Return on ad spend4.1x
Cost per purchase£18.40
Hook rate, top creative32%
Creative fatigue2 sets
Live account snapshotScaling
Account Performance Creative Spend
4.1x

Blended return on ad spend at scale

Cost per purchase£18.40
Creatives tested this month42
Event match quality8.7 / 10
Ads Manager · 30 day viewSpend up 62%

Meta Advertising Agency Built On Creative Volume

Meta's algorithm does most of the targeting now. What still separates a good account from a bad one is how many genuinely different creative angles you put in front of it, and how honest your tracking is about which ones worked. That is where we spend our time.

  • New angles every week. A steady flow of fresh hooks, formats and messaging tested against your winners, so performance never rests on one ad that is already fatiguing.
  • Simple account structure. Consolidated campaigns that give the algorithm enough data to learn, rather than forty ad sets each starved of conversions.
  • Tracking you can trust. Conversions API and server side events set up properly, with event match quality monitored, so the numbers in Ads Manager reflect real revenue.
  • Reporting against blended numbers. Platform ROAS next to what your bank account actually shows, because in-platform attribution alone will always flatter itself.
Facebook Campaigns Audiences Testing
£42K

Monthly spend managed on this account

ProspectingBroad, advantage+ audience 3.4x
RetargetingSite visitors and engagers 7.2x
Advantage+ shoppingCatalogue driven 4.8x
Cold testingNew angles, capped budget 1.9x
Campaign split · 30 day viewBlended 4.1x

Facebook Ad Management Services That Scale

Most accounts stall at the same point: a campaign works at five thousand a month and falls apart at twenty. Our Facebook ad management services are built for that transition, with a structure and creative pipeline that hold their return as budget increases.

  • Full funnel, not just retargeting. Prospecting, warm audiences and retention running together, so growth is not capped by the size of your remarketing pool.
  • Budget moved on evidence. Scaling decisions made on statistically meaningful data rather than a good Tuesday, with clear rules for when to increase and when to cut.
  • Advantage+ used deliberately. Automated placements and campaigns applied where they genuinely outperform, alongside manual control where they do not.
  • Landing pages in scope. Ads are only half the equation, so we test page speed, offer and message match rather than blaming the platform for weak conversion rates.
Instagram Reels Stories Feed
32%

Hook rate on the top performing Reel

Spend on Reels placements58%
Three second view rate41%
Placement view · 6 month trendCPA down 34%

Instagram Ads Management Services For Reels

Instagram now runs on vertical video, and a repurposed square image will not survive there. Our Instagram ads management services build for the placement first: native looking Reels and Stories that earn the first three seconds instead of being scrolled past.

  • Vertical video made properly. Reels and Stories shot and edited for the format, with hooks written to hold attention past the first three seconds.
  • UGC and creator content. Sourced, briefed and tested against your polished brand assets, because on Instagram the less produced version often wins on cost per acquisition.
  • Read at the frame level. Hook rate, hold rate and drop off points reviewed per creative, so the next round fixes the exact second people are leaving.
  • Fatigue caught early. Frequency and performance decay watched per creative, with replacements ready before your cost per purchase starts climbing.
Process Section Preview
How we work

A clear path from audit to rankings.

No black box reporting. You will know exactly what we are doing and why, every step of the way.

01
Audit
We crawl your site, review your niche, and map exactly where you are losing visibility today.
02
Strategy
A prioritized roadmap: technical fixes, content targets, and link opportunities, ranked by impact.
03
Execution
Our team implements the roadmap on-site, on-page, and off-site, while you run your business.
04
Reporting
Monthly reporting on rankings, traffic, and revenue impact, plus a call to plan what is next.
Proof, not promises

Every claim here comes with the dashboard behind it

Search visibility, domain authority and local presence, pulled straight from the reporting we send clients each month. Click any screenshot to see the raw data for yourself.

Organic search
25.1K
Total clicks from Google Search
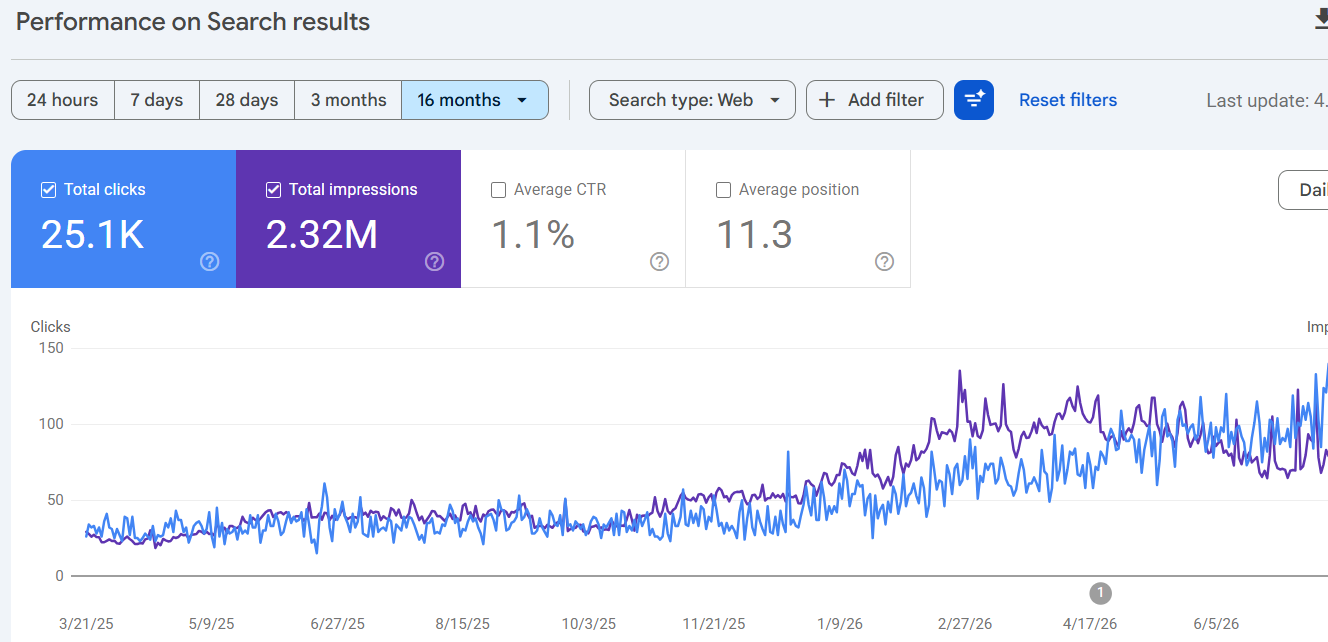
Google Search Console performance report showing 25.1K total clicks and 2.32M impressions across 16 months Search Console screenshot
Total impressions2.32M
Average CTR1.1%
Average position11.3

2.32M impressions converted into 25.1K clicks at a 1.1% average CTR, with an average position of 11.3 across all tracked queries. Daily clicks and impressions both climbed from a flat baseline to sustained highs across the 16 month window.
Search Console · 16 months
Traffic & authority
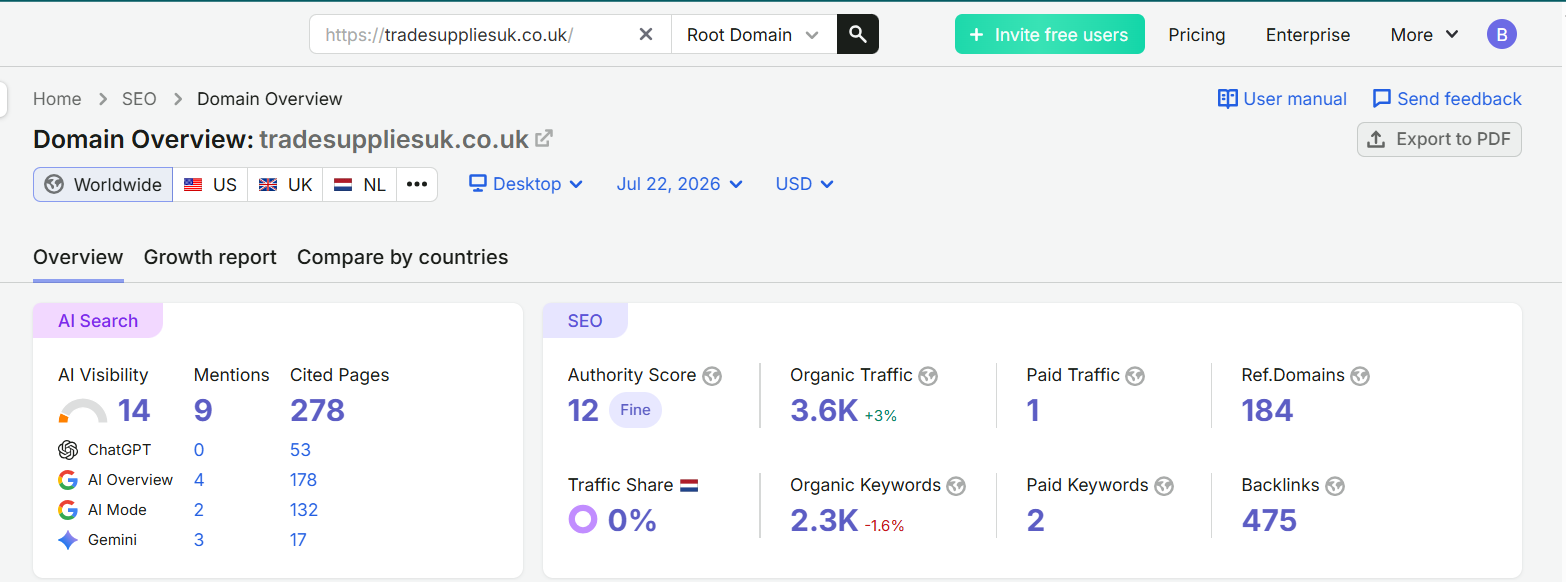
3.6K+3%
Monthly organic traffic
Semrush domain overview showing 3.6K organic traffic, 2.3K organic keywords, authority score 12, 184 referring domains and 475 backlinks Semrush screenshot
Organic keywords2.3K
Authority score12
Referring domains184
Backlinks475

3.6K monthly organic visits, up 3%, drawn from 2.3K ranking keywords. The profile is backed by 475 backlinks across 184 referring domains, with AI visibility at 278 cited pages and 9 mentions.

Semrush · Domain overview
Local SEO
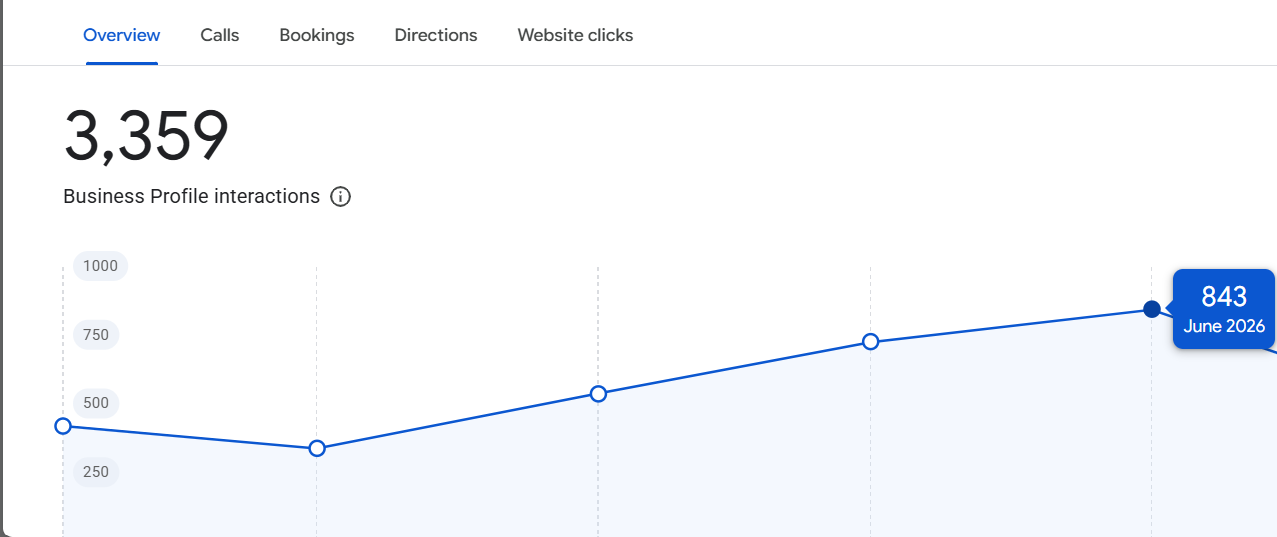
3,359
Business Profile interactions
Google Business Profile performance overview showing 3,359 total interactions rising to 843 in June 2026 Business Profile screenshot
Peak month843
Starting month462
Growth to peak+82%
Monthly average560

3,359 Business Profile interactions across the period, climbing from 462 in the opening month to 843 by June 2026. Calls, bookings, direction requests and website clicks all trended upward together after the first quarter.

Business Profile · 6 months
Enlarged screenshot
Testimonial Carousel Preview
FAQ Section Preview
Questions

Meta Advertising Agency FAQs

What does a Meta advertising agency actually do?

Strategy, creative production, campaign build and daily media buying across Facebook and Instagram, plus tracking setup and reporting. In practice most of the work is creative testing and reading the data it produces, since that is what decides whether an account scales.

What minimum ad spend do you work with?

Around £3,000 a month is the point where there is enough data to test properly and make decisions on evidence rather than guesswork. Below that, the account rarely gets out of the learning phase often enough to be worth managing.

Do your Facebook ad management services include creative?

Yes. Static ads, vertical video edits, ad copy and UGC briefing are all included, because a media buyer without a creative pipeline runs out of things to test within a few weeks.

How are Instagram ads management services different from Facebook?

The buying happens in the same account, but the creative does not transfer. Instagram runs on vertical video and native looking content in Reels and Stories, so those placements get built for specifically rather than inheriting a resized Facebook asset.

How long before campaigns become profitable?

The first two to four weeks are testing, where the goal is finding which angles work rather than hitting a target return. Most accounts reach a stable, profitable position in month two, then scaling begins from there.

Who owns the ad account and the creative?

You do. We work inside your Business Manager with partner access, and every asset we produce is yours to keep. If we ever part ways, you leave with the account, the data and the creative intact.

How do you report on performance?

A monthly report covering spend, blended return, cost per acquisition and creative performance, alongside a live dashboard you can check any time. Platform figures are always shown next to actual revenue, since in-platform attribution overstates its own contribution.

CTA Section Preview

Find out what your ad account is really doing.

Get a free Meta ad account audit covering structure, creative performance and tracking accuracy. You will see where spend is being wasted, which creatives are carrying the account, and what it would take to scale without losing your return.

Get my free account audit
Delivered in 5 working days. No lock-in contracts.